
Performance Report
The Performance report is a tool for analyzing recipients’ engagement and overall performance of your email campaigns. It shows how emails are read, which ones generate clicks, and how many users unsubscribe — all linked to the day the corresponding email was sent, not the actual date of the event.
This report helps you assess content quality, audience interest, and track the dynamics of key metrics.
How it works
The report data is based on the email send date, not the particular events’ date (e.g., open or click).
For each email with a unique message_id, each status is counted only once. For example, if a particular email was opened, got two clicks, and one unsubscribe, the statistics will show one open, one click, and one unsubscribe.
The data is displayed as an area chart showing the percentages for each status.
The chart displays both percentages and absolute event numbers.
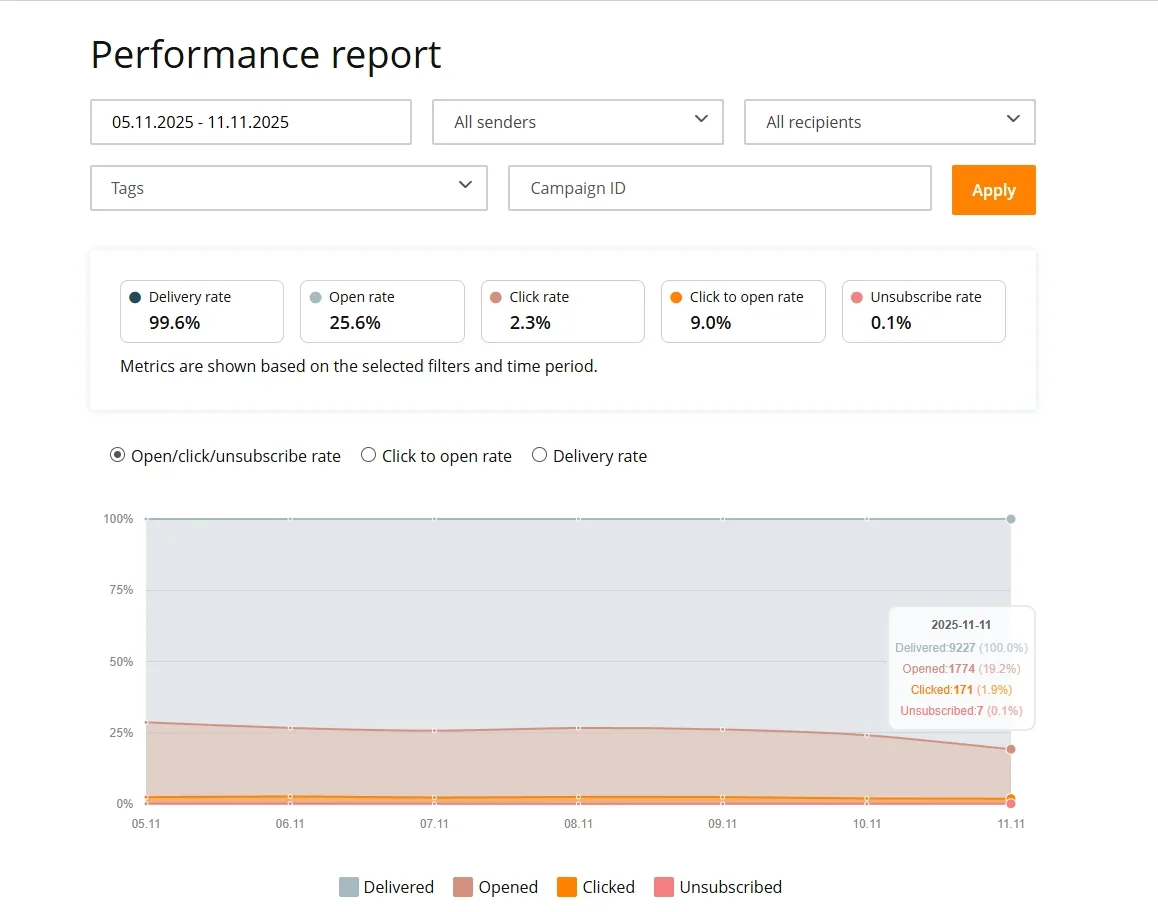
Display modes
You can switch to one of these three display modes using the radio buttons just above the graph:
- Reads / Clicks / Unsubscribes
Displays the following statuses:
- Delivered (shown as 100% for each day)
- Reads
- Clicks
- Unsubscribes
Shows the percentage of unique emails read, those with at least one click, and unsubscribes, relative to the total number of delivered emails. All events are based on the sending date, not the moment of reading or clicking.
- Clicks to Reads
Displays the following statuses:
- Read (100%)
- Clicks
Displays the percentage of emails with at least one click, relative to the total number of emails opened.
- Deliverability
Displays the following statuses:
- Sent (100%)
- Delivered
Displays the percentage of delivered emails relative to those sent.
Sample period
The report data is available for the past 185 days. For each report, you can select a period of up to 31 days.
Where to find the tool
To access the report page, log into your personal account and open Statistics → Performance.
